Charts
A bunch of reproducible charts. All data and source code are available on this repo.
All charts are licensed under a Creative Commons Attribution-ShareAlike 4.0 International License

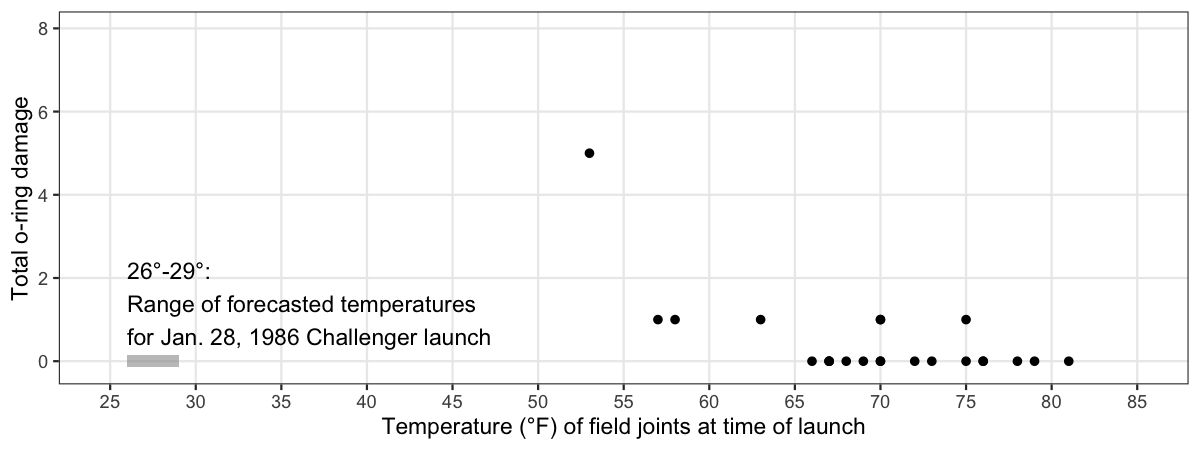
challengerOrings
Description: Reproduction of Tufte’s famous scatterplot of rocket o-ring damage vs. launch temperature for test launches prior to Jan. 28, 1986 Challenger launch. Original figure in Tufte E.R. 1997. Visual Explanations. Graphics Press. Cheshire, Connecticut, U.S.A.
Data: Presidential Commission on the Space Shuttle Challenger Accident, Vol. 1, 1986: 129-131.
climateChangeBarcode
Description: “Barcode” plots showing the long term rise in global and US temperatures. Each vertical stripe represents the average temperature of a single year, ordered from the earliest available data to the present. Original figures by Ed Hawkins.
Data: 1) NASA (2018) “Goddard Institute for Space Studies (GISS)”; 2) NOAA National Centers for Environmental information.

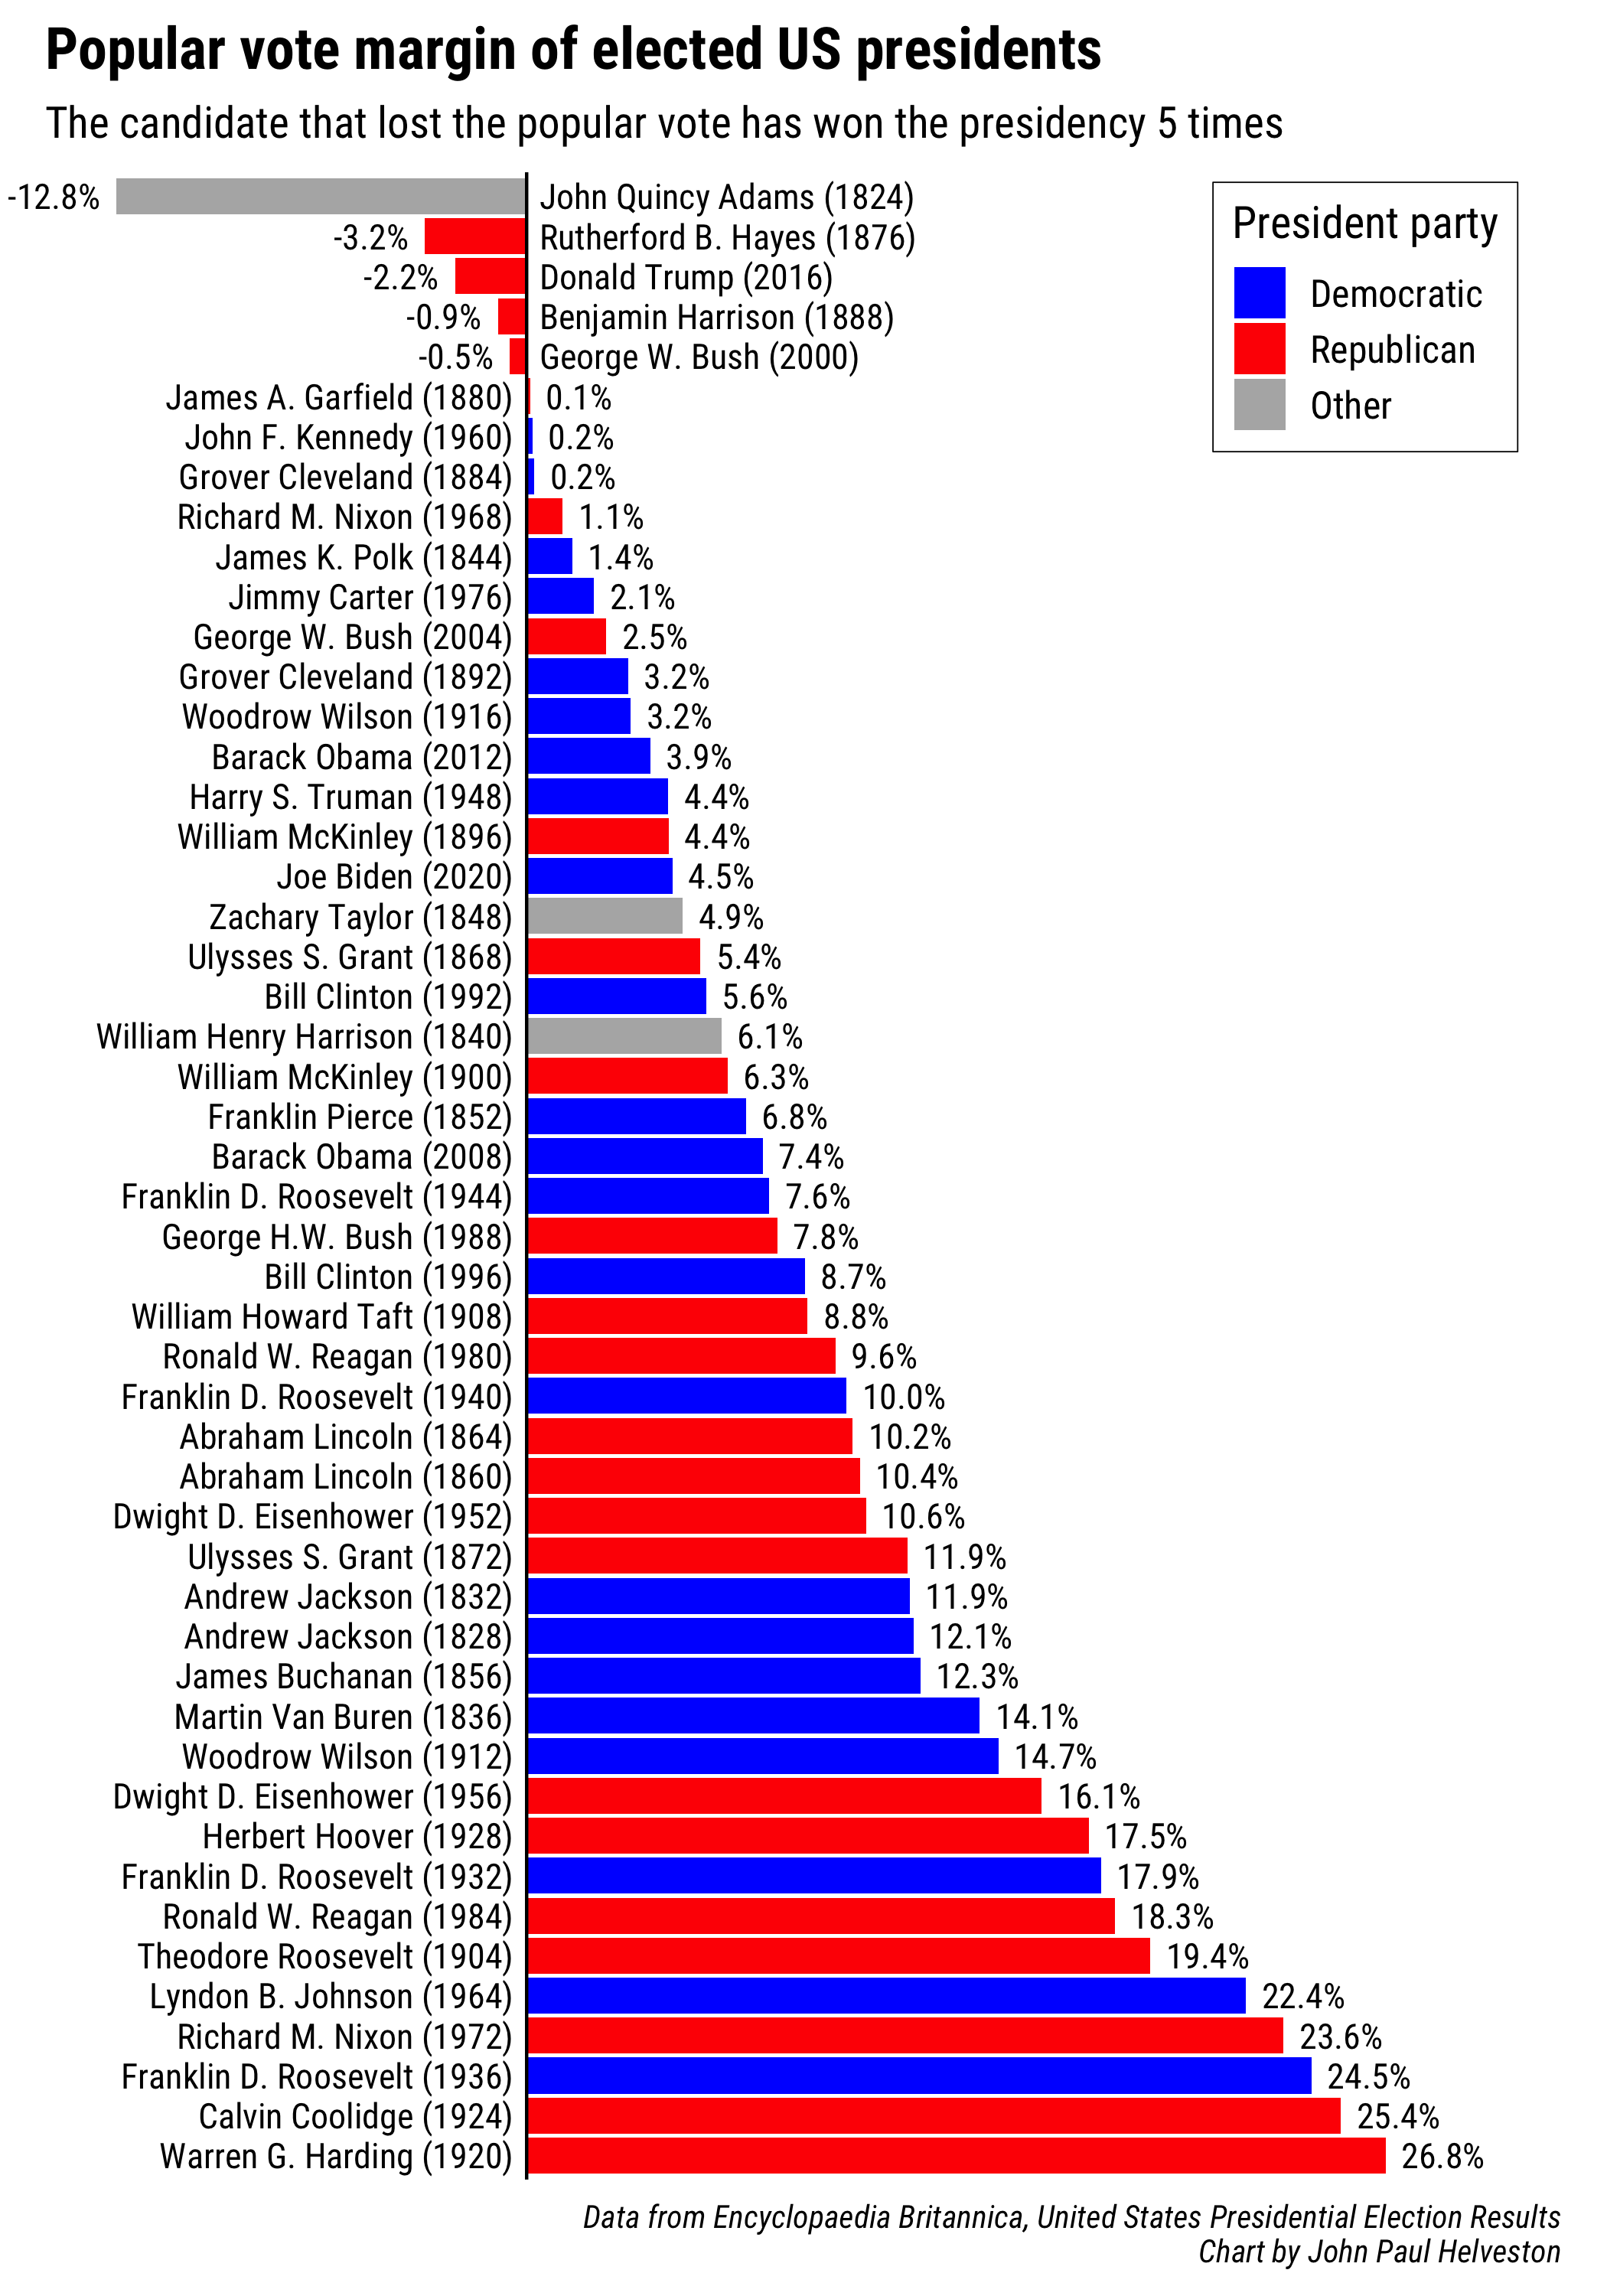
electionMargins
Description: Bar plots of the popular vote margin by elected U.S. Presidents from 1824 to present.
Data: Encyclopaedia Britannica, United States Presidential Election Results.
electricityEIA
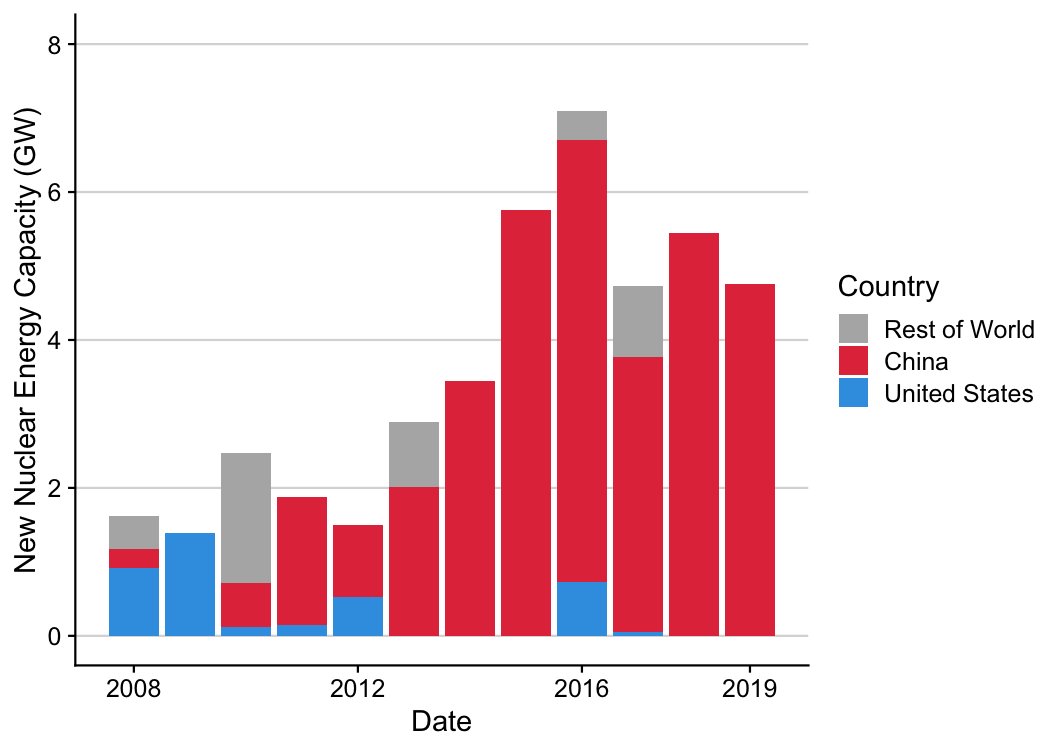
Description: Barplots of energy capacity and generation by country / region using EIA data.
Data: U.S. Energy Information Administration (EIA).
![]()
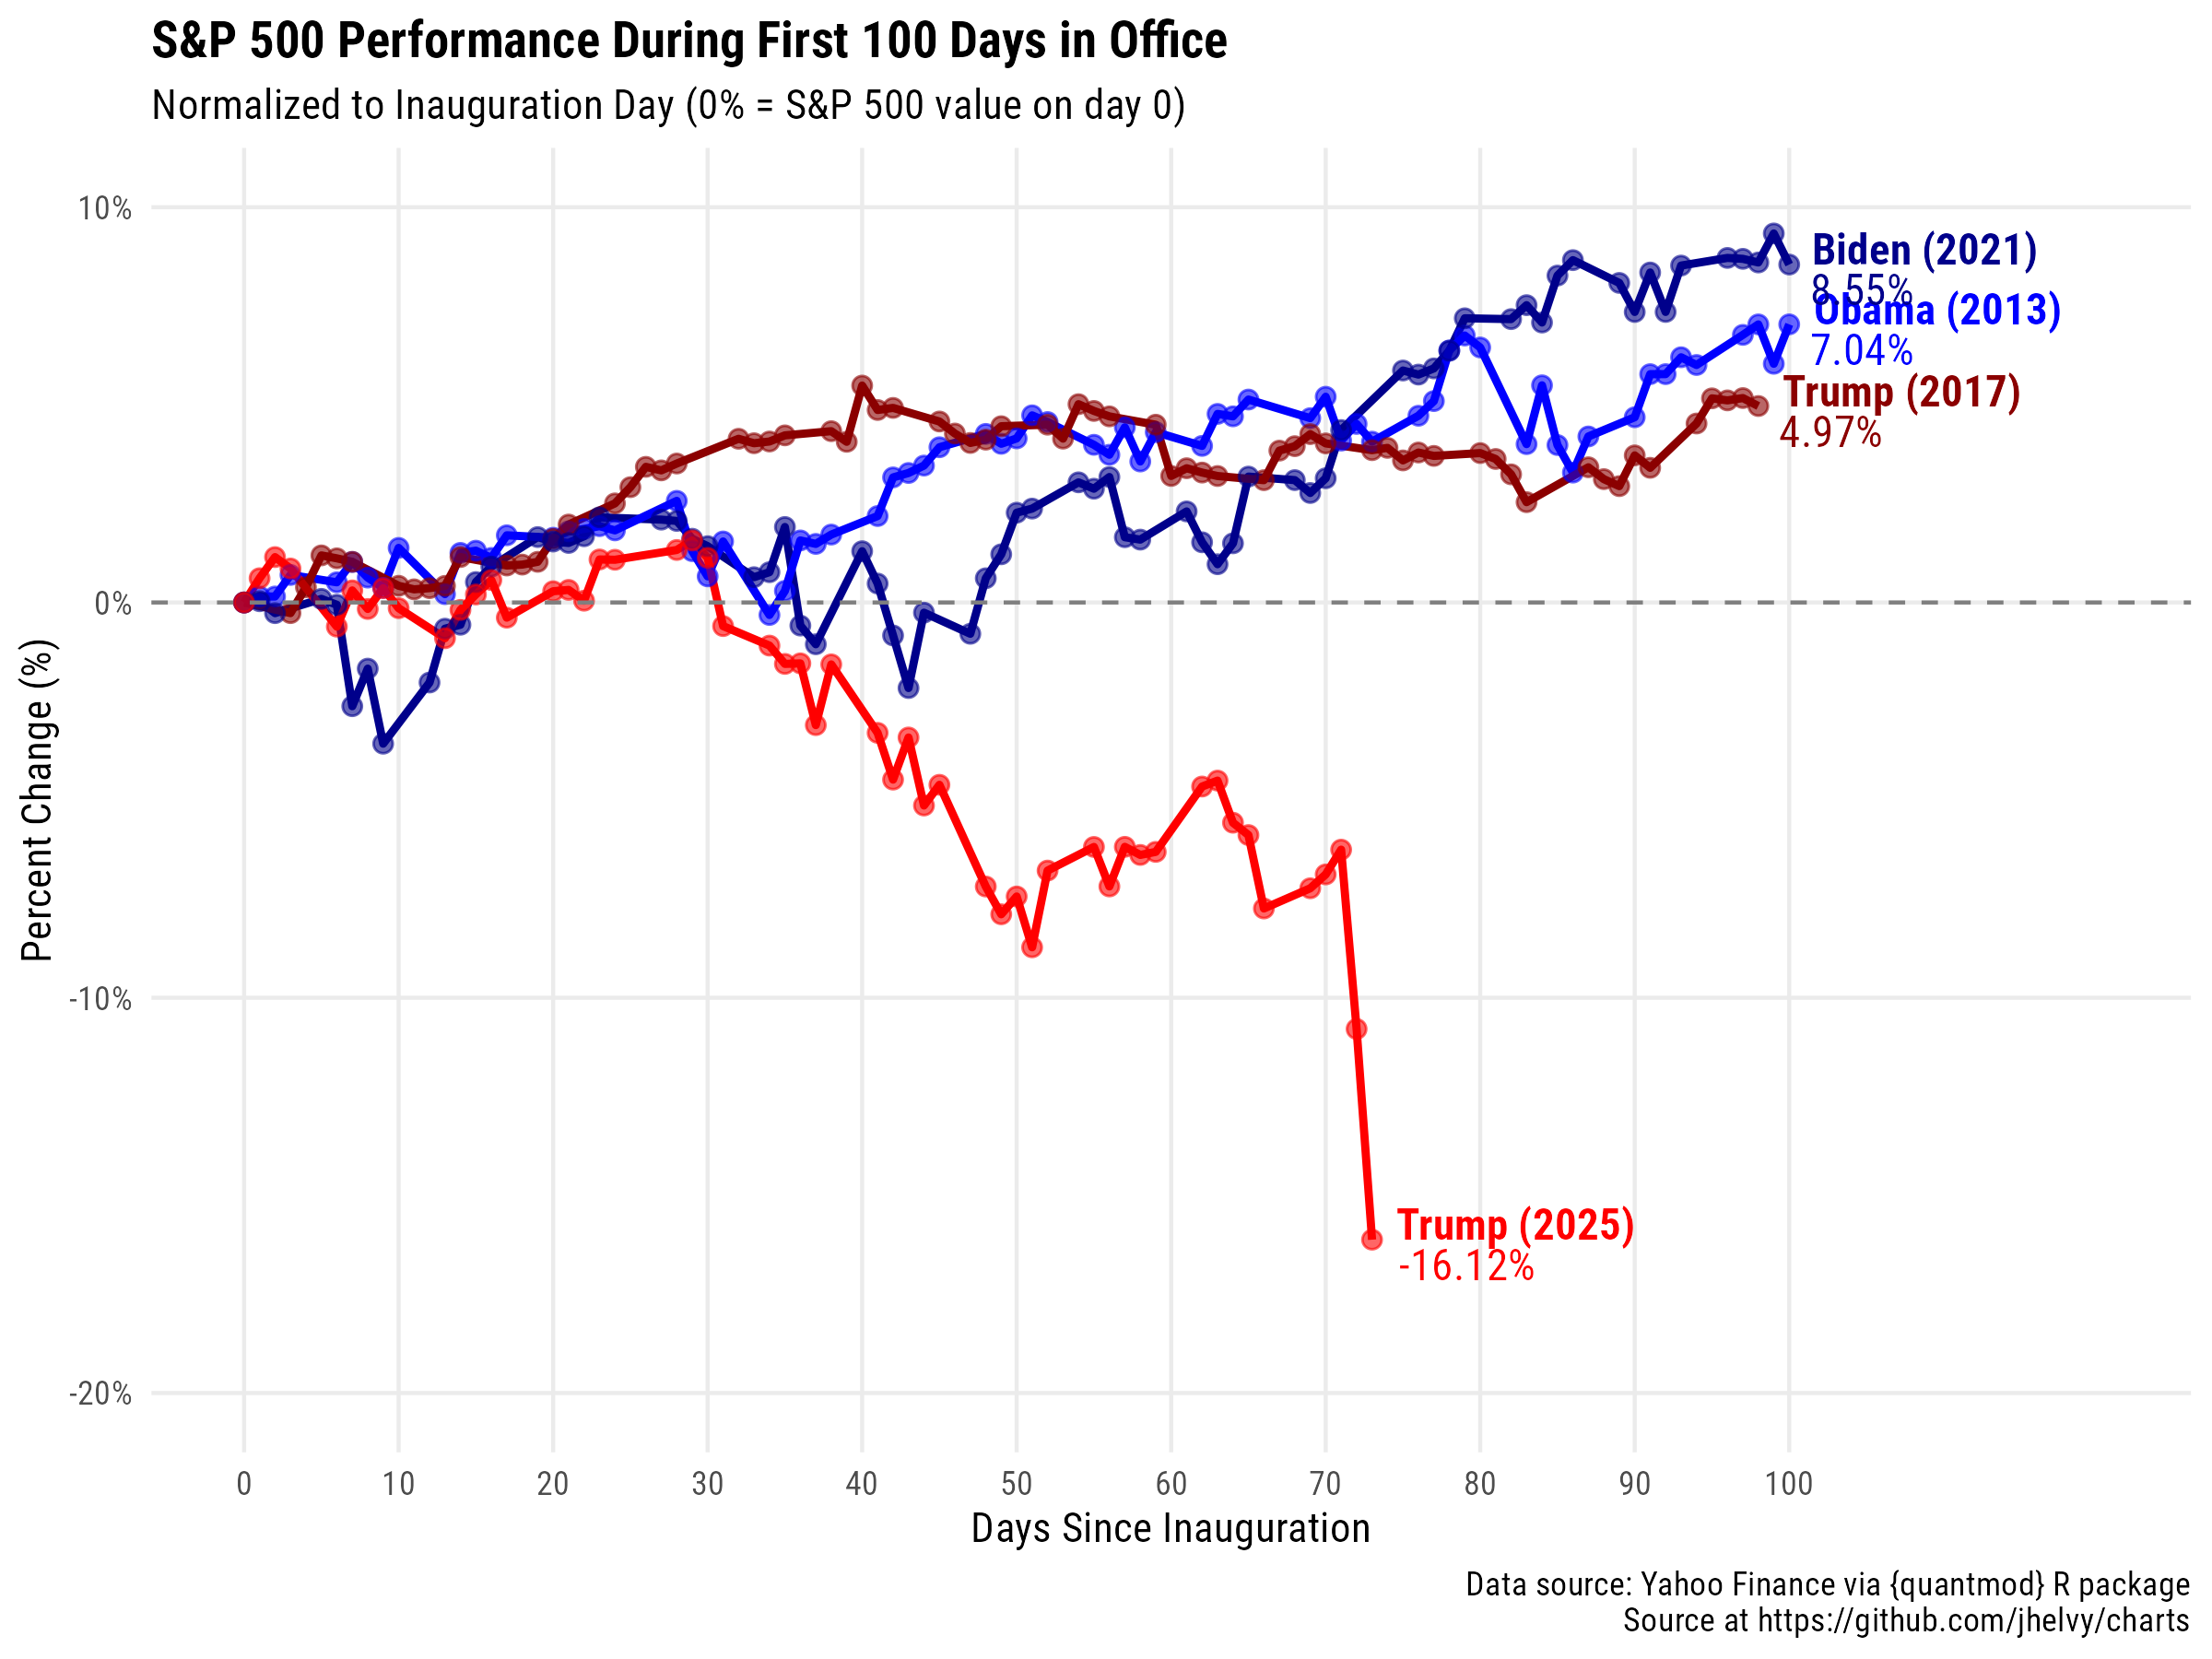
hundredDaysSP500
Description: Comparison of the S&P performance relative to day 0 of the presidency for the past four US presidents.
Data: Yahoo Finance via {quantmod} R package
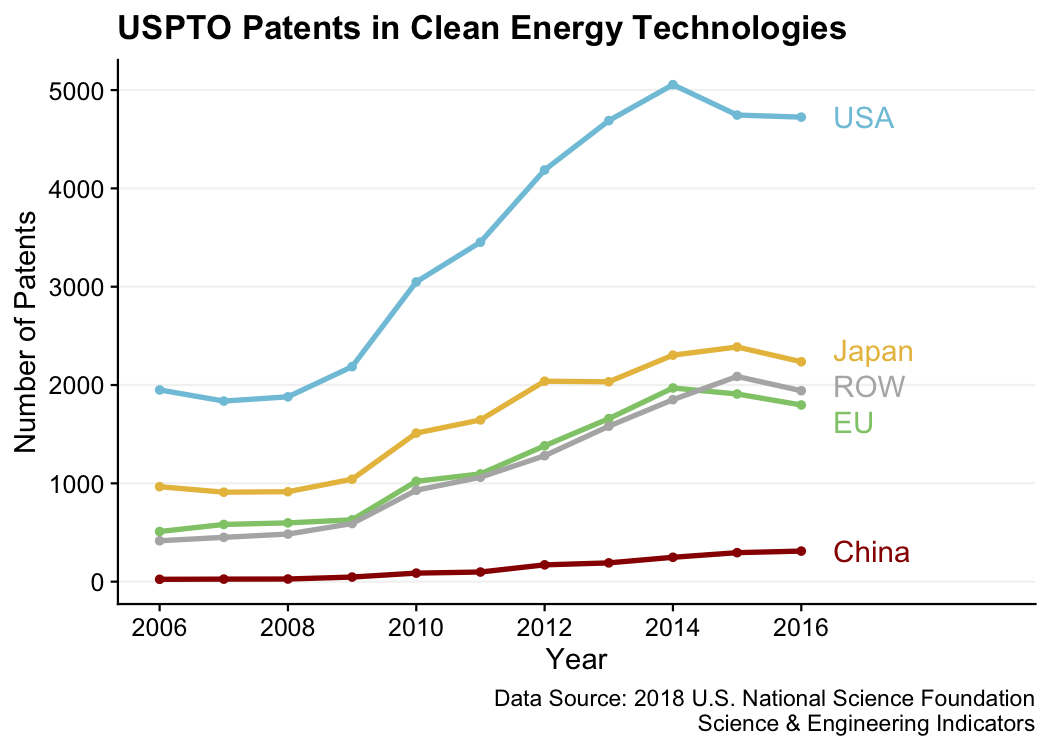
lcetPatenting
Description: Patenting in clean energy technologies by country and over time.
Data: 2018 U.S. NSF Science & Engineering Indicators.
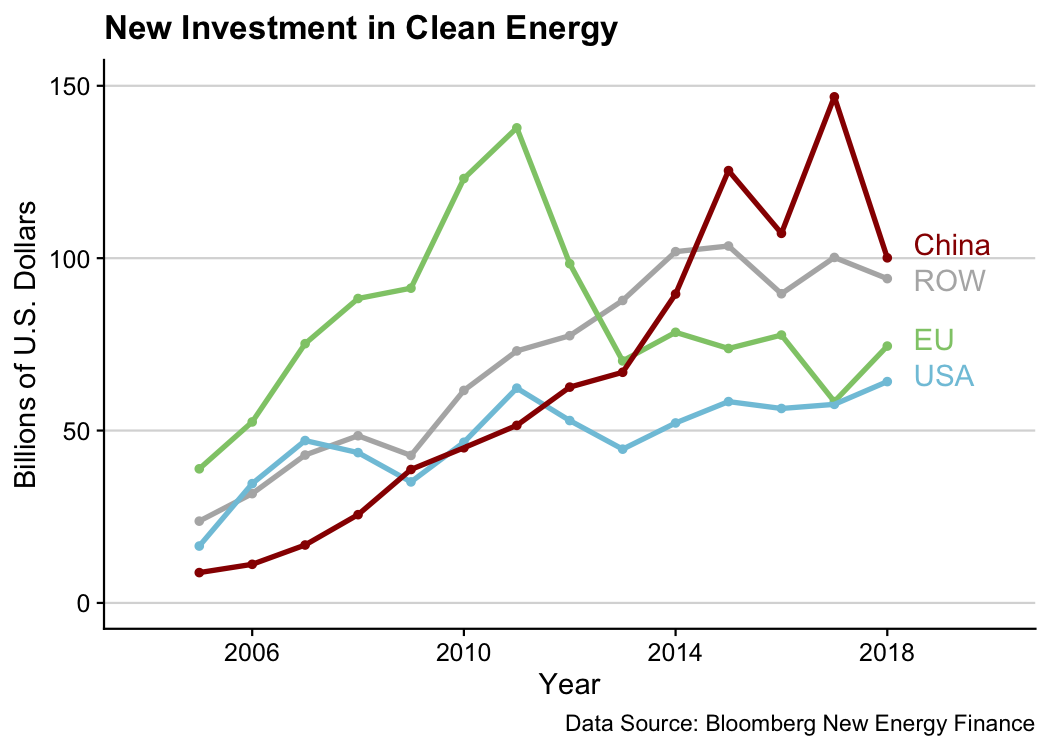
newEnergyInvestment
Description: Plots of new clean energy investment by country and type.
Data: Clean energy investment by Bloomberg New Energy Finance.
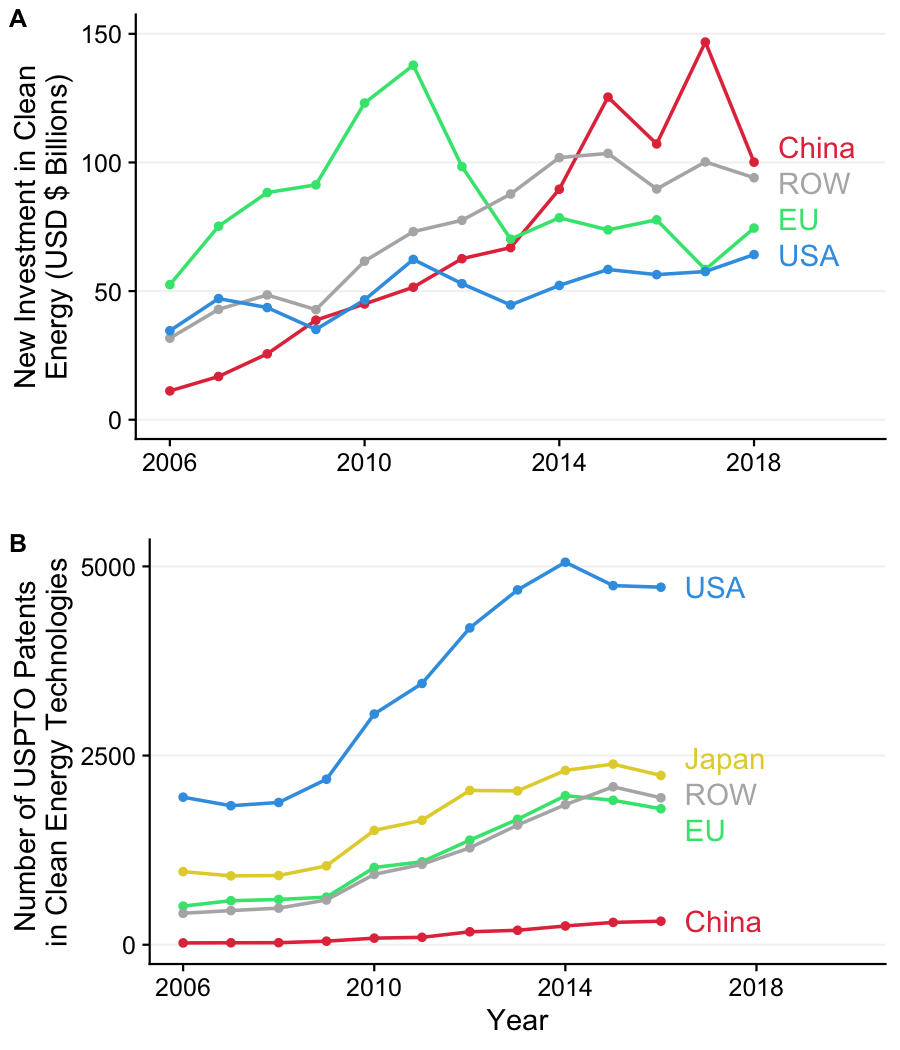
scienceCommentary2019
Description: The chart in our 2019 Science Policy Forum article - investment and patenting in clean energy technologies by country and over time.
Data: Clean energy investment by Bloomberg New Energy Finance; Patenting by 2018 U.S. NSF Science & Engineering Indicators.
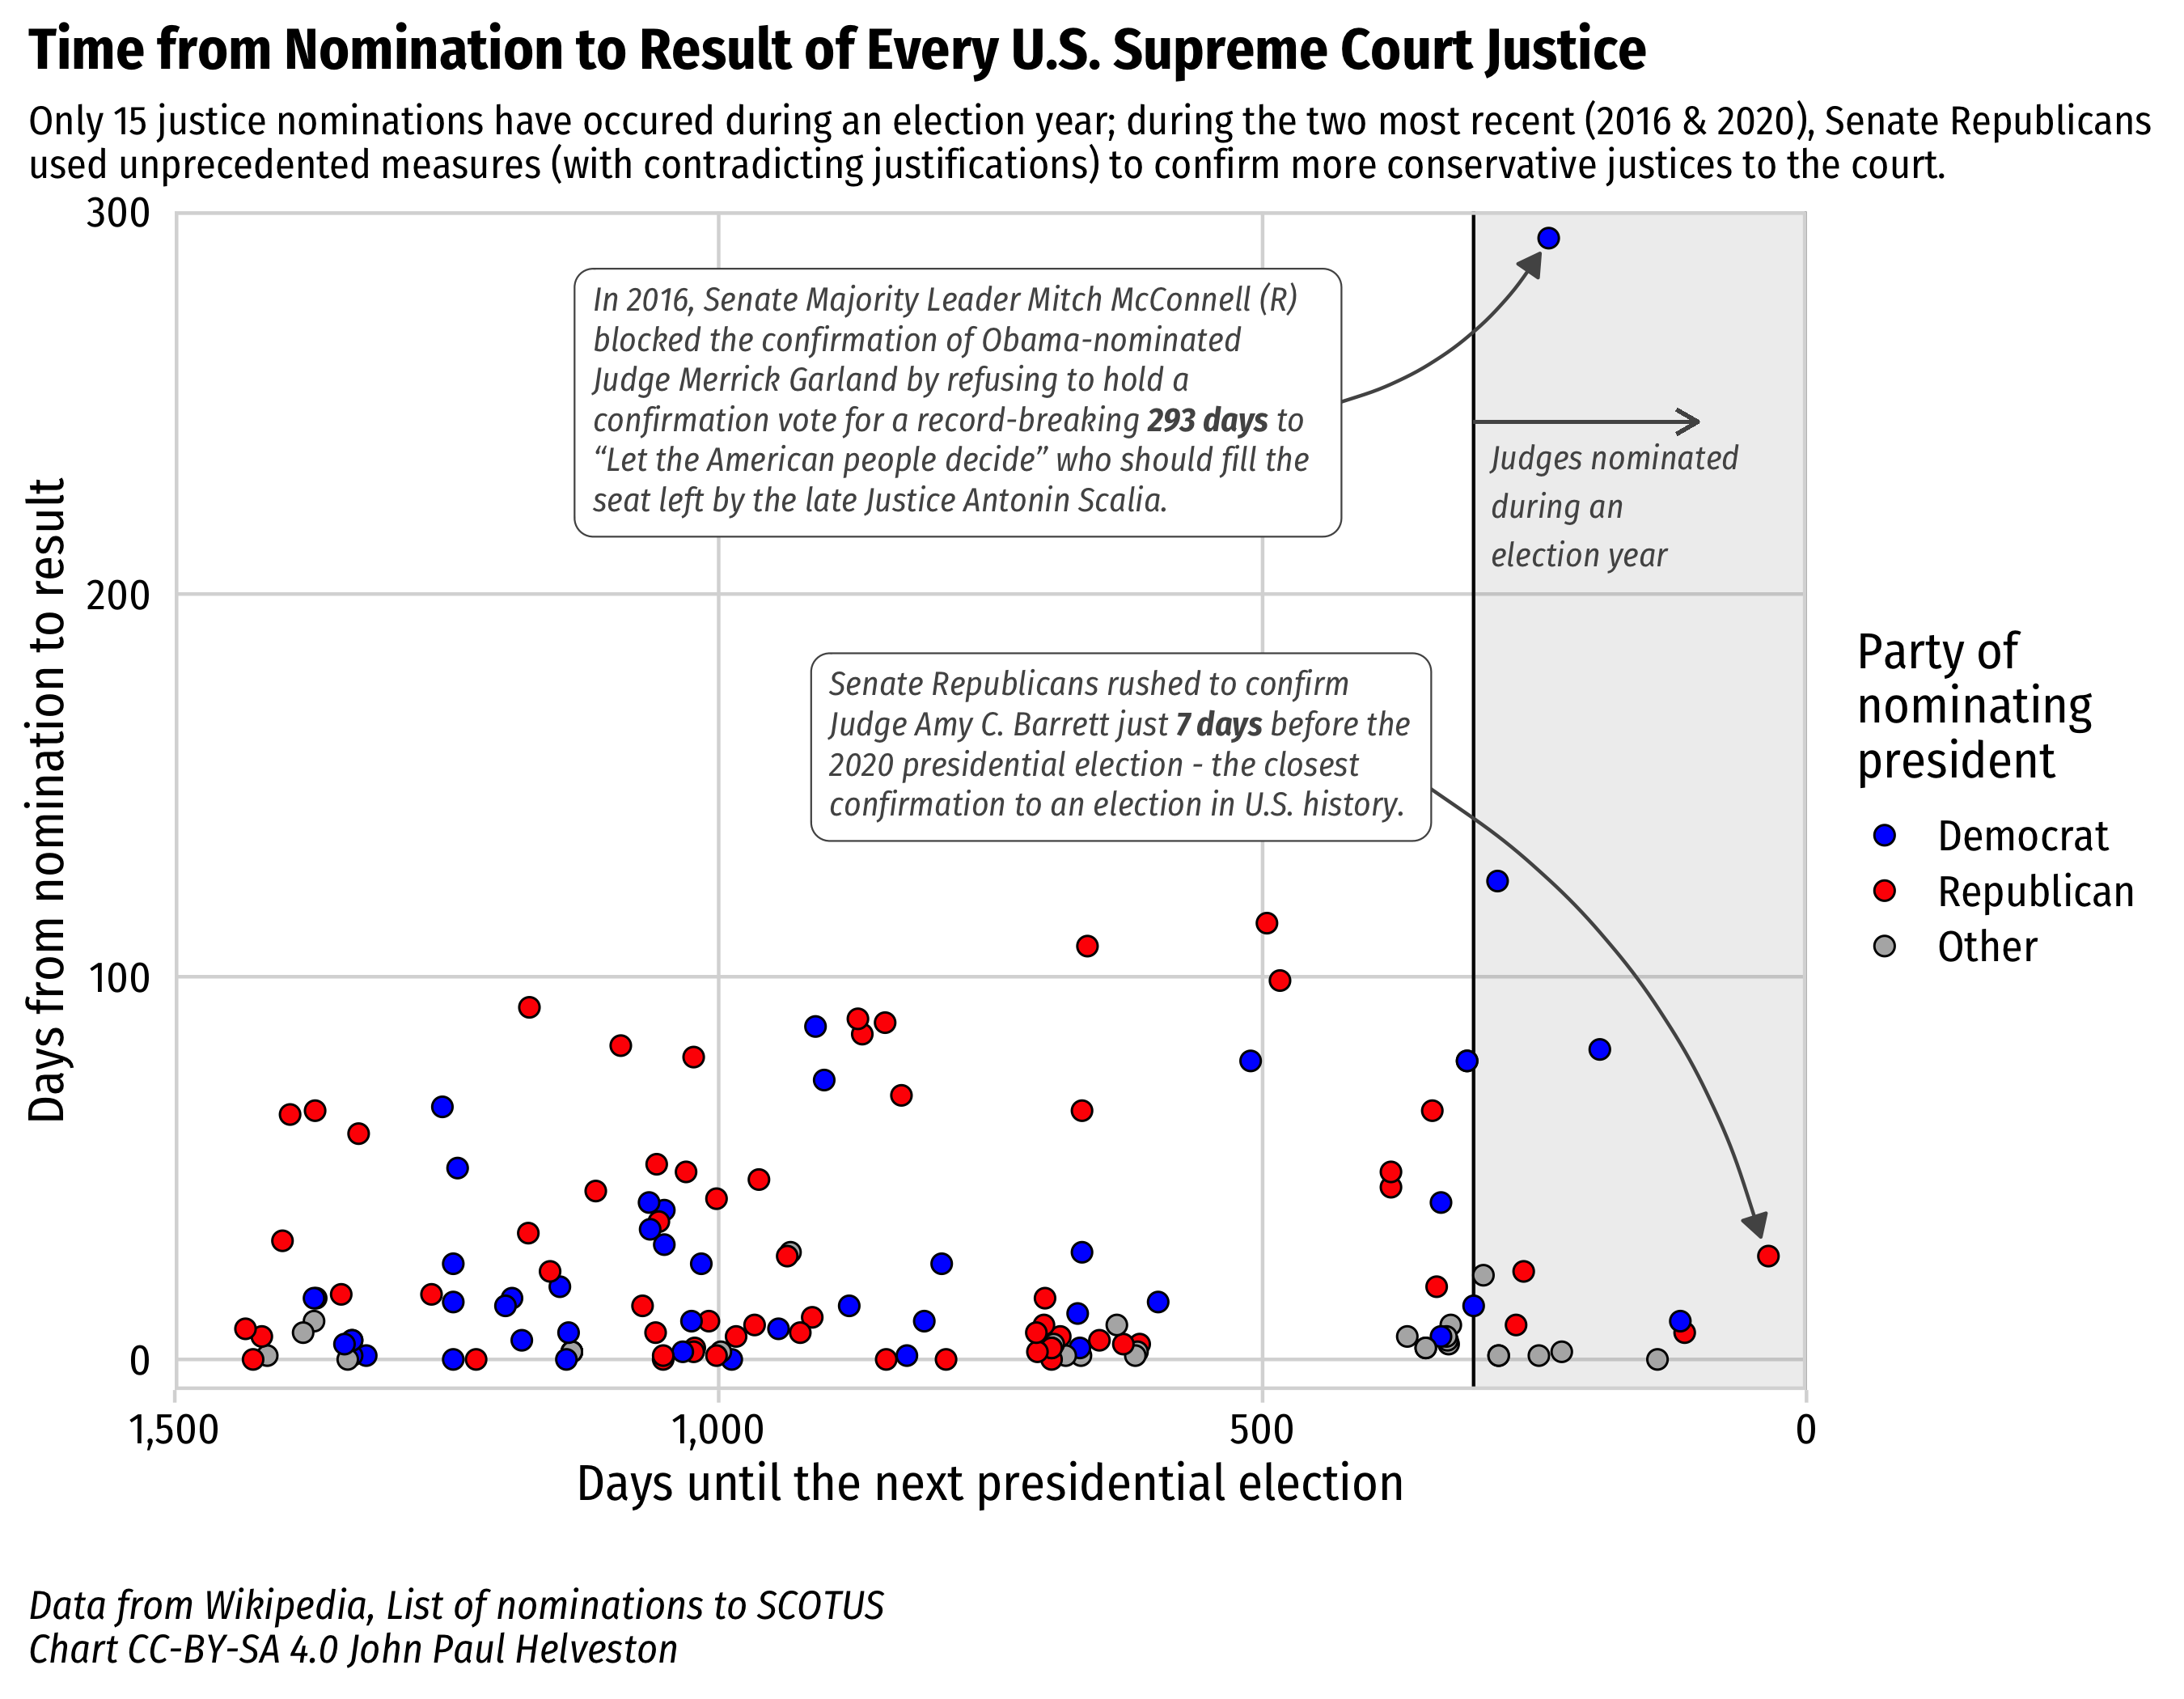
scotusNominations
Description: Time from Nomination to Result of Every US Supreme Court Justice.
Data: Wikipedia The Green Papers.
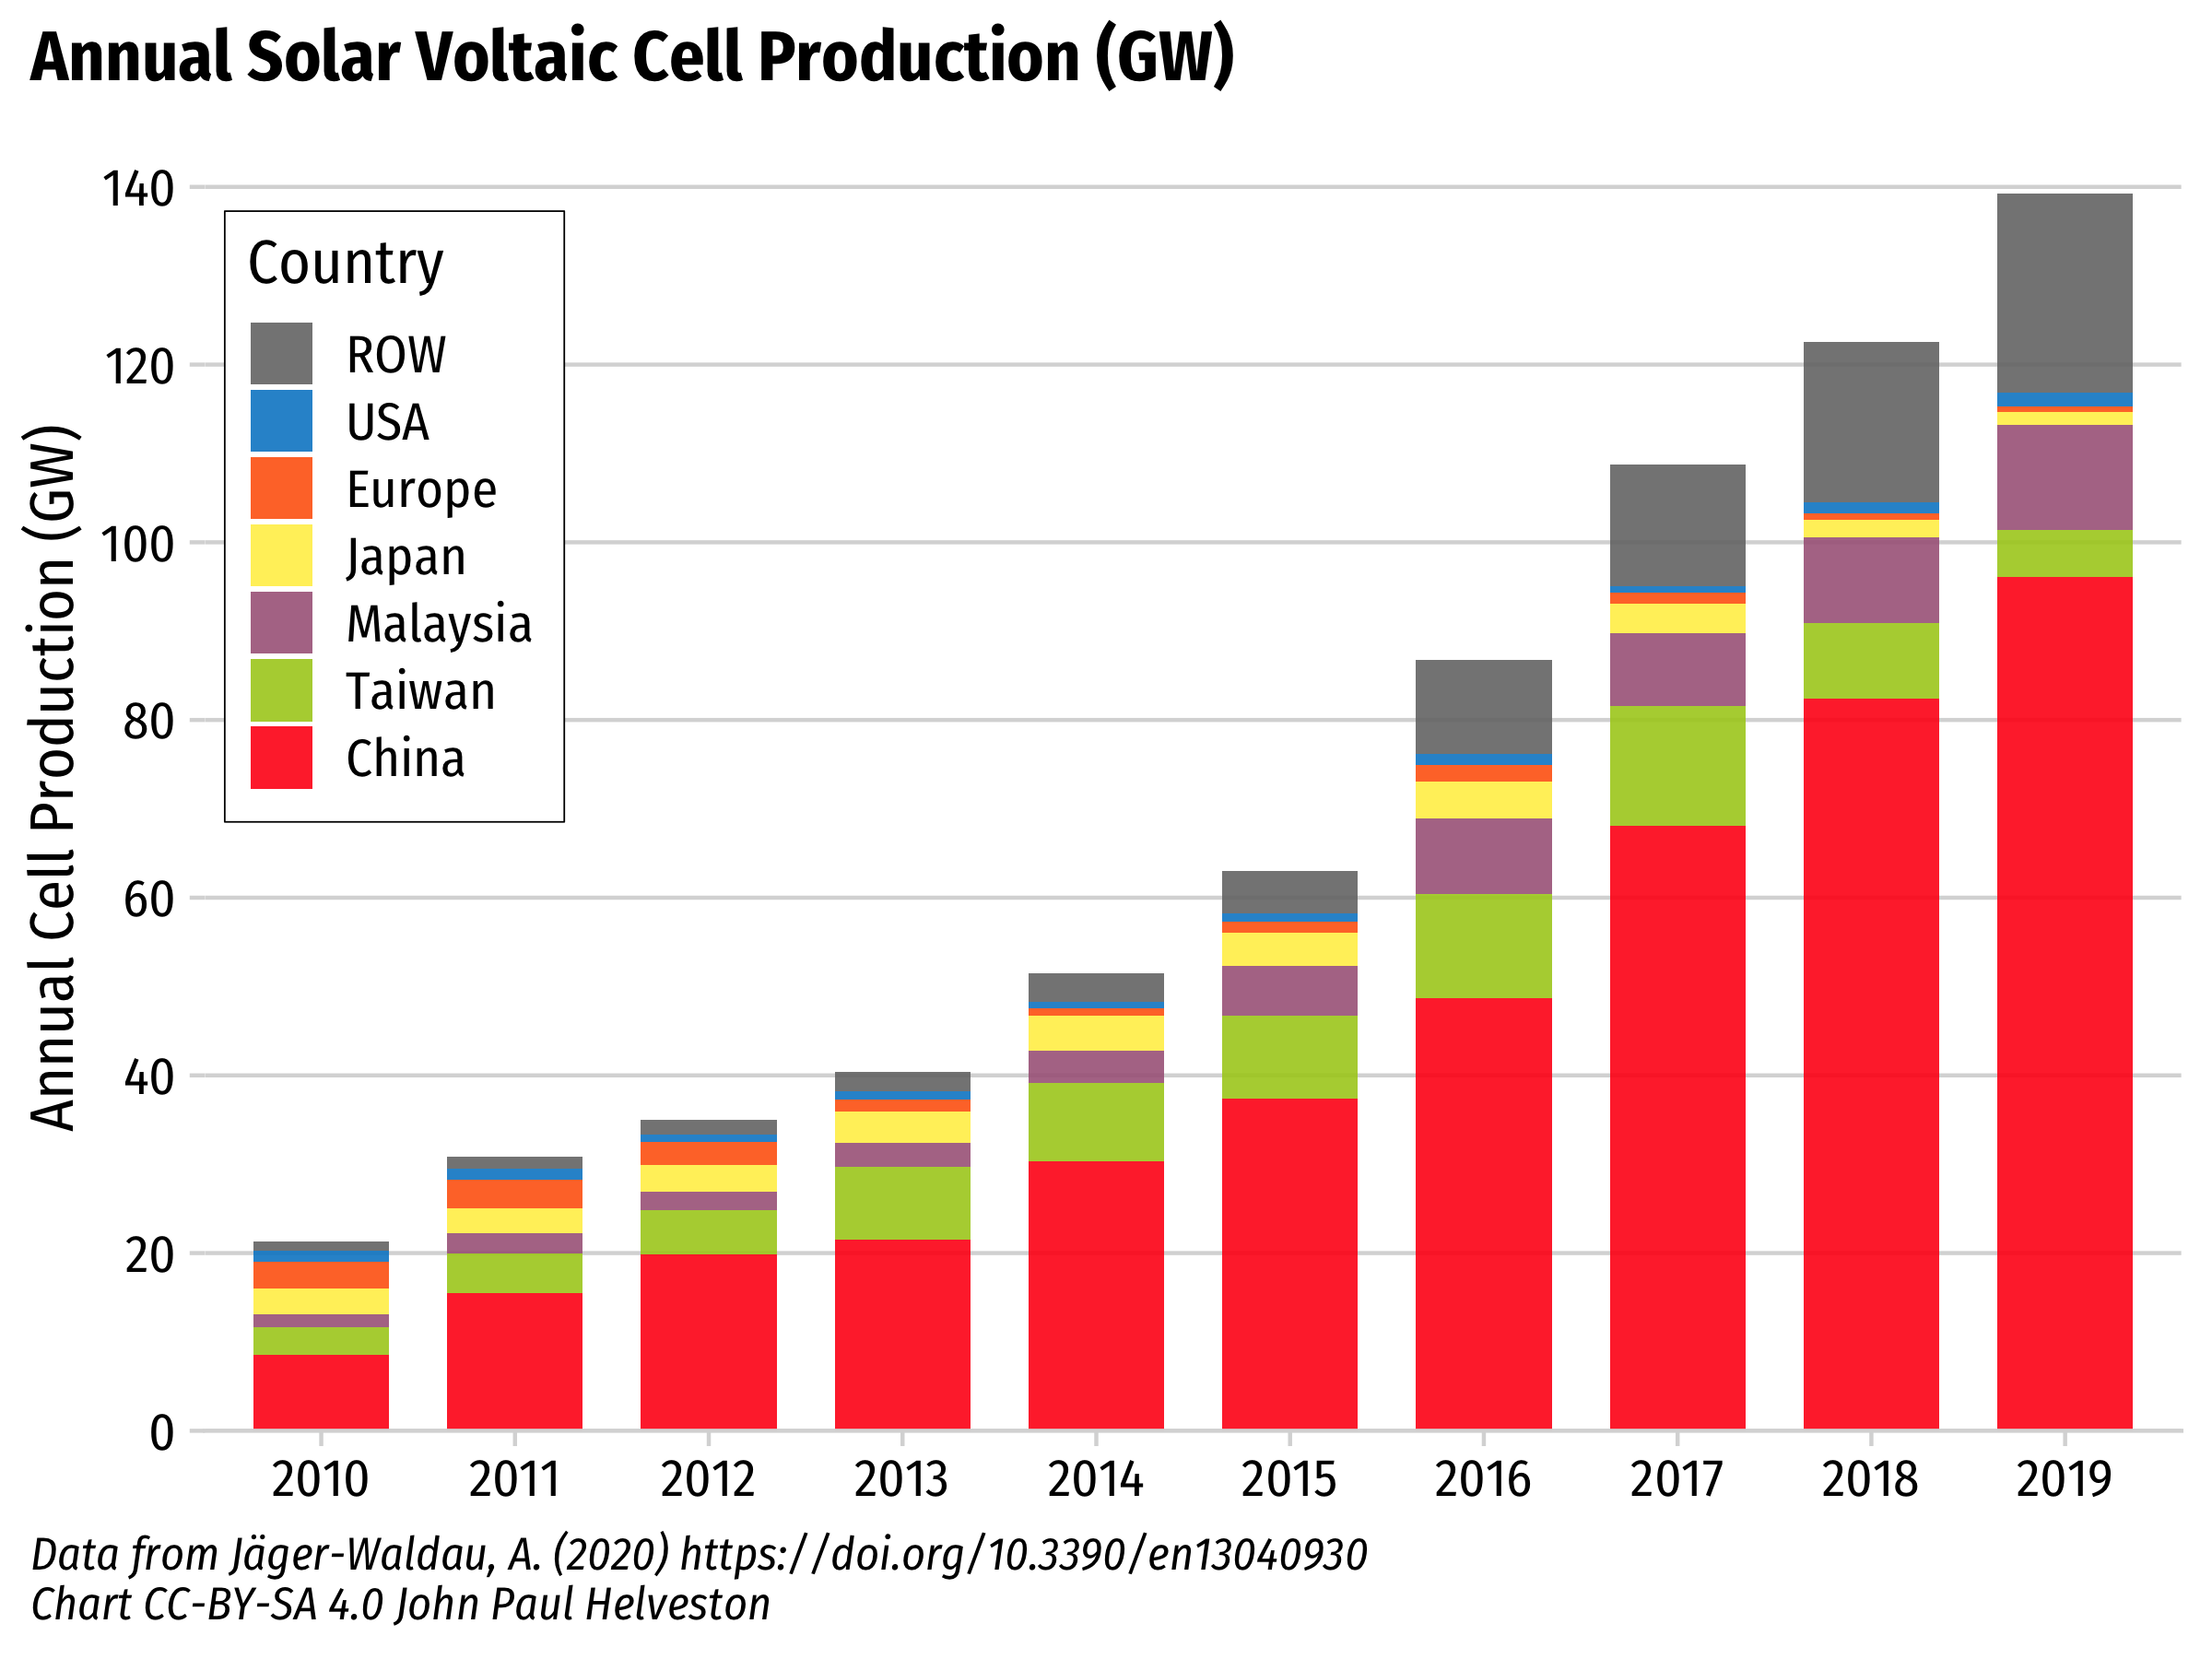
solarPvProduction
Description: Bar plot of global annual solar photovoltaic cell production by country.
Data: 1995 to 2013: Earth Policy Institute; 2014 to 2018: Jäger-Waldau, A. (2019). Snapshot of Photovoltaics—February 2019. Energies, 12(5), 769. Data reverse engineered from Figure 1 using WebPlotDigitizer.
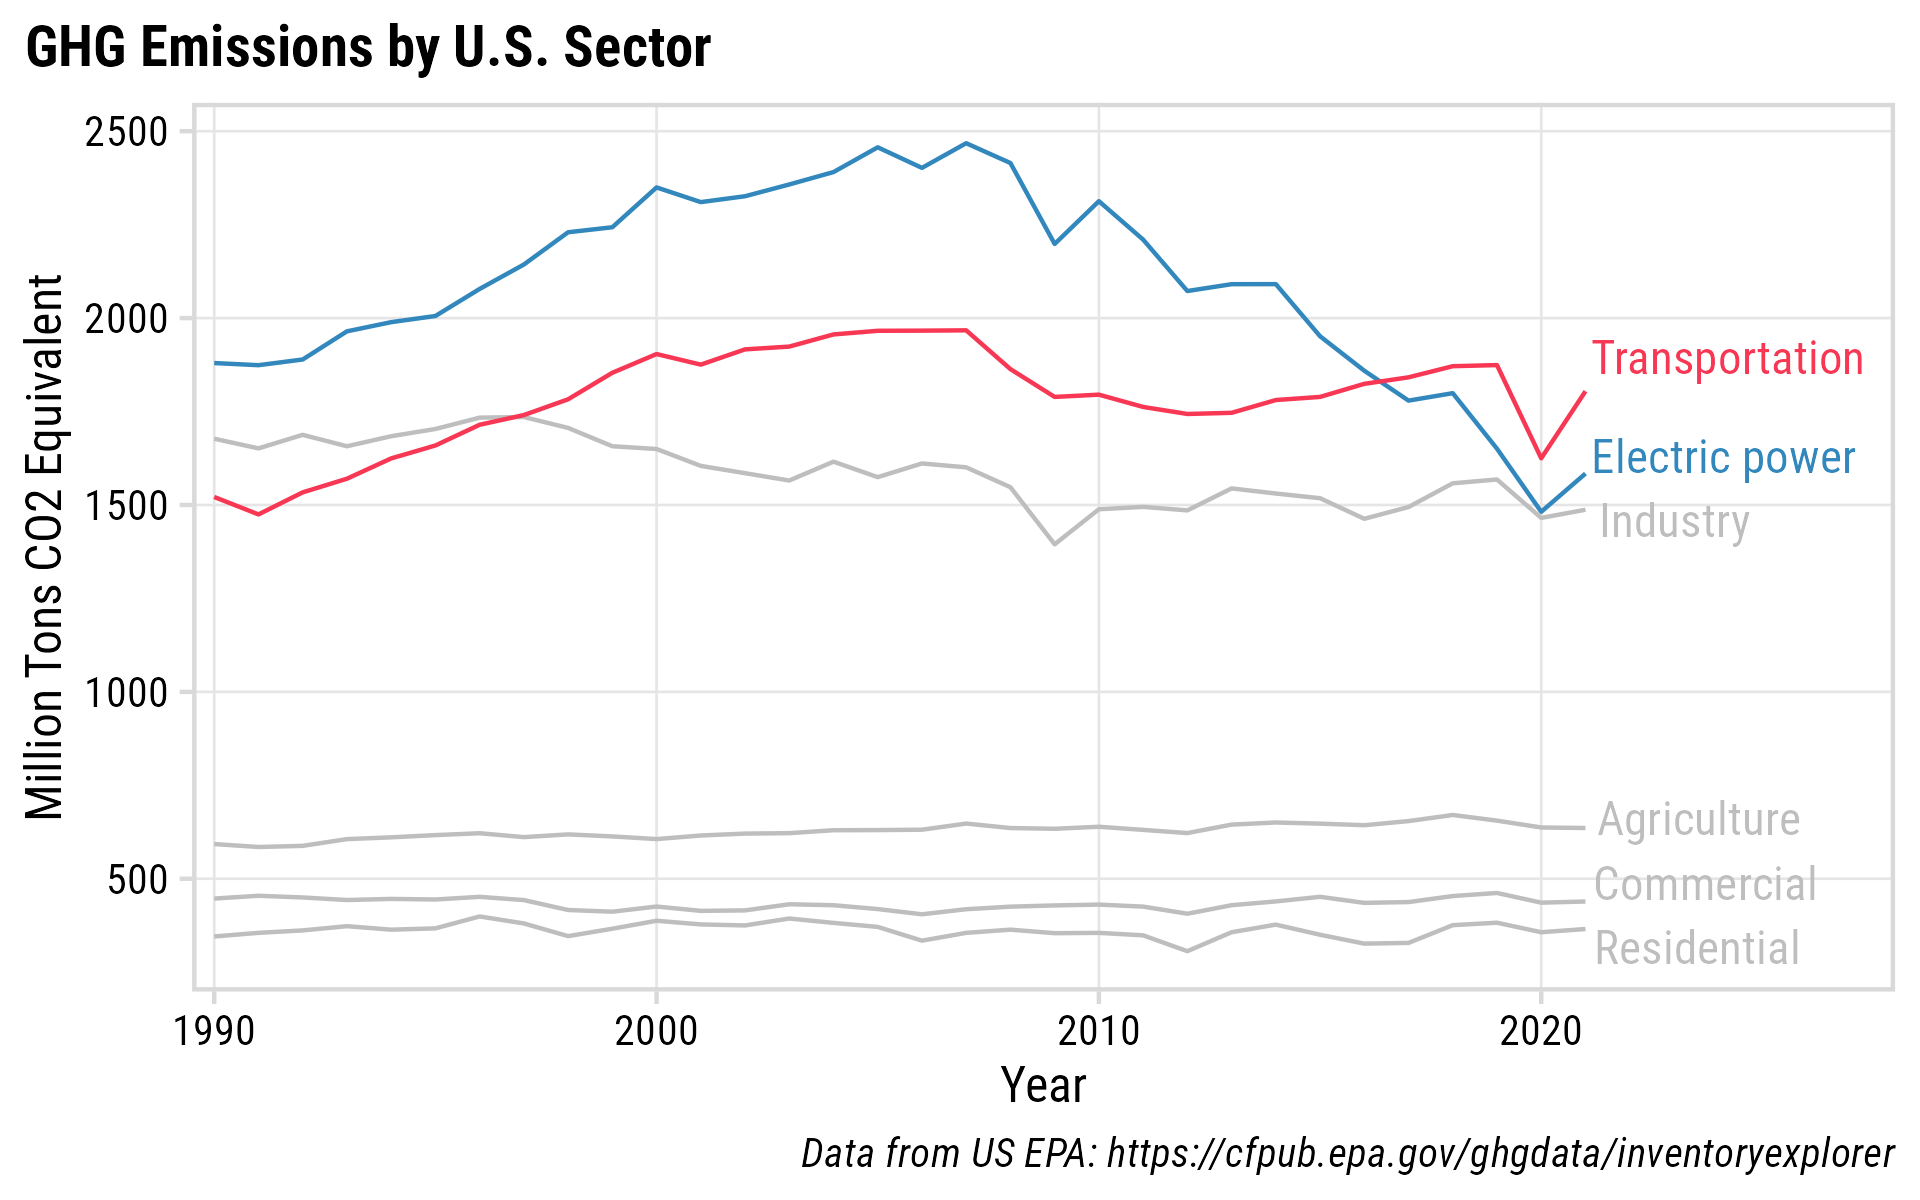
usGHGs
Description: Line chart of US greenhouse gas emissions by sector. Data are from the US EPA.
Data: U.S. EPA Greenhouse Gas Inventory Data Explorer
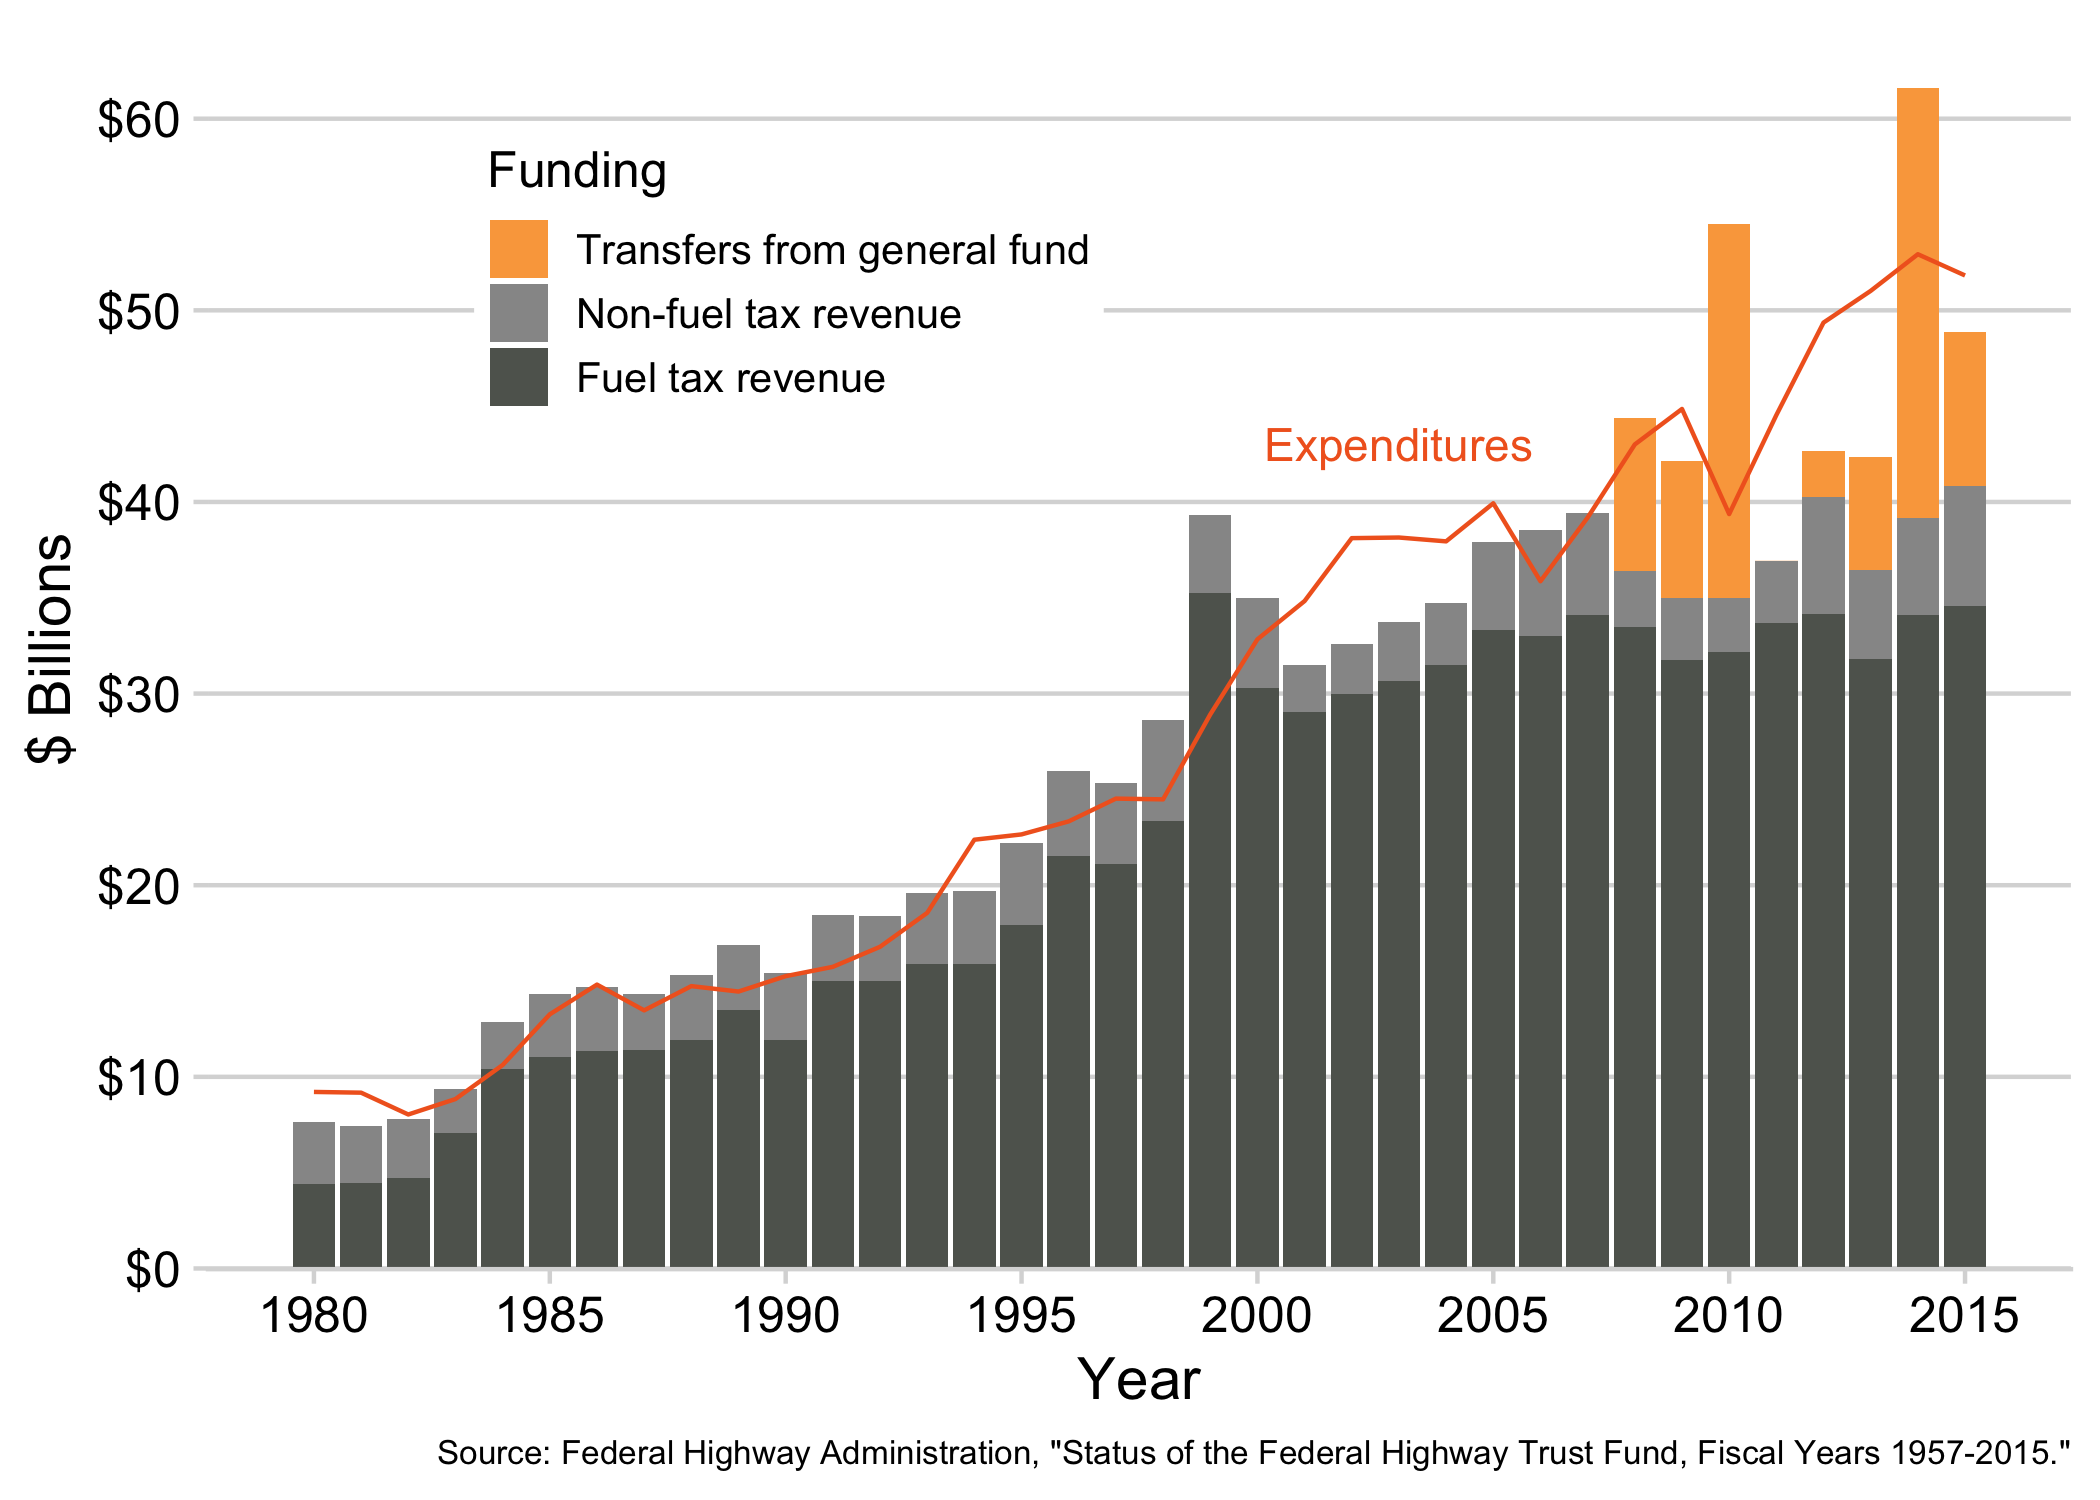
usHighwayFund
Description: The chart in my 2017 article: “Perspective: Navigating an Uncertain Future for US Roads,” Issues in Science and Technology 34, no. 1 (Fall 2017)”. The chart shows federal highway fund revenues and expenditures in real dollars from 1980 to 2015.
Data: Status of the Highway Trust Fund, Fiscal Years 1957-2015.
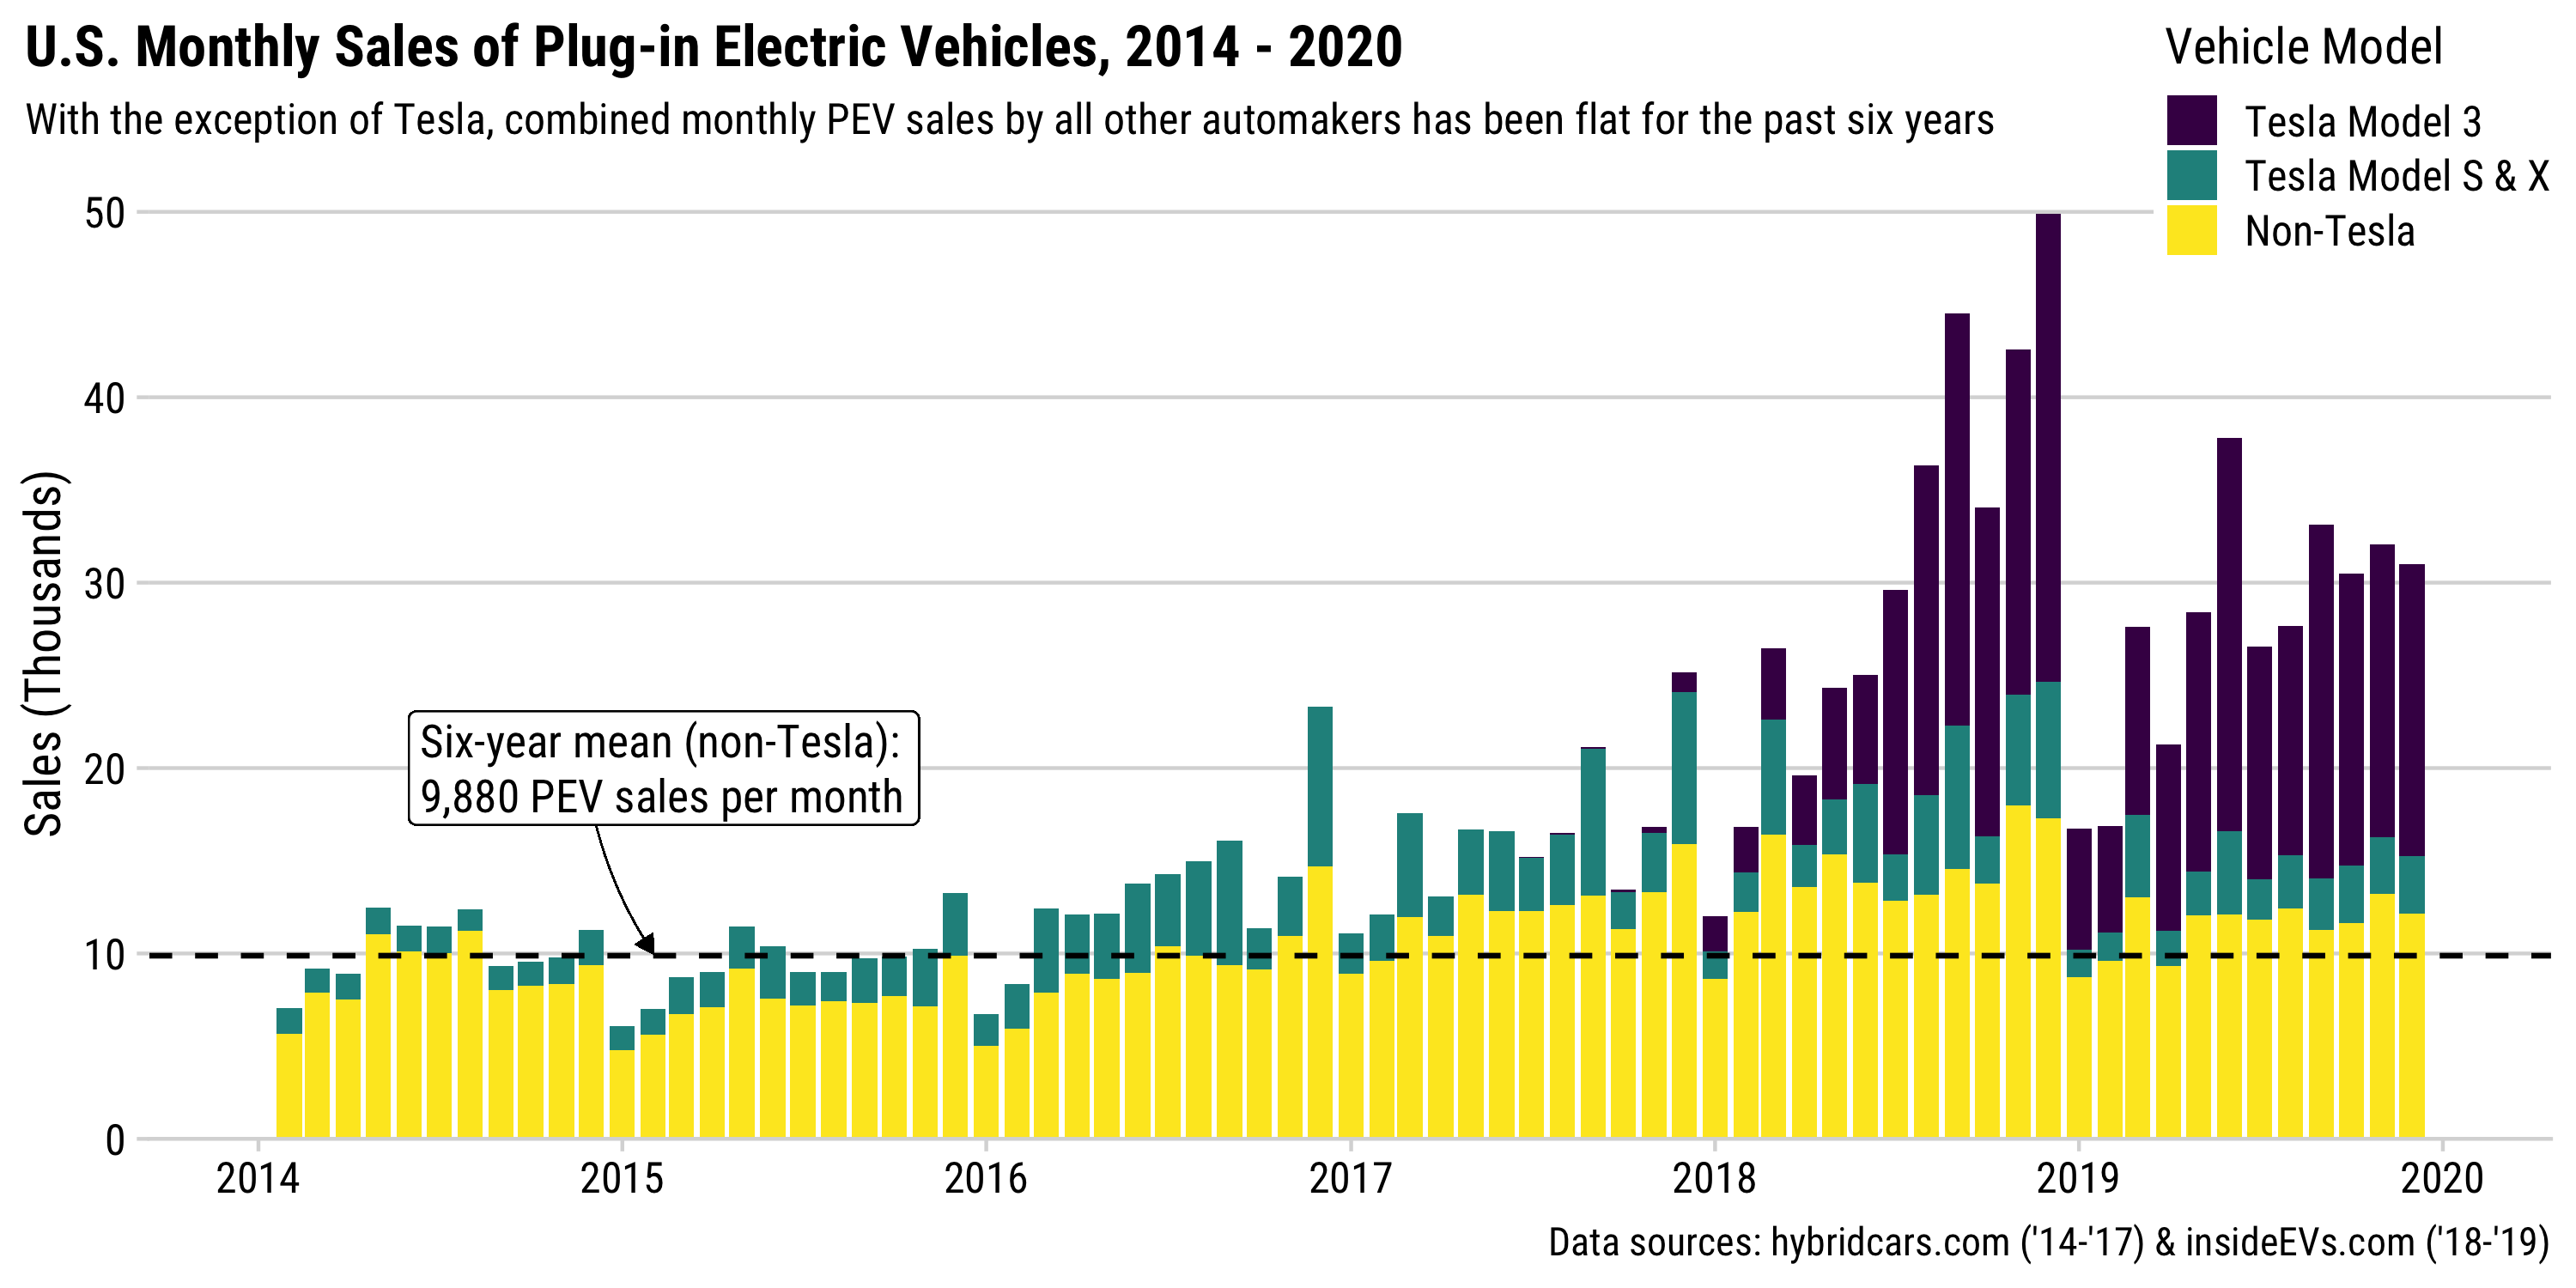
usPevSales
Description: The chart in my 2021 article in Issues in Science and Technology titled, “Why the US Trails the World in Electric Vehicles”. The chart shows monthly sales of plug-in electric vehicles in the US from 2014 to 2020.
Data: hybridcars.com (’14-’17) and insideEVs.com (’18-’19).
worldNuclearAssociation
Description: Barplots of nuclear energy capacity by country.
Data: Webscraped data from the World Nuclear Association.