library(dplyr)
alts <- jsonlite::unserializeJSON(df_json) %>%
  filter(qID == 1)
alt1 <- alts %>% filter(altID == 1)
alt2 <- alts %>% filter(altID == 2)
alt3 <- alts %>% filter(altID == 3)Choice-based conjoint surveys in R with formr
R
tutorial
conjoint
A how-to guide for using R to design and implement choice-based conjoint surveys using formr.org
formr.org is a flexible platform for making surveys using . In this post, I’m going to show you one approach for using formr to create a choice-based conjoint survey (I’m going to assume that you know what conjoint surveys are, but if not take a look at this quick introduction).
Throughout this post, I will use a demo survey about people’s preferences for apples with three attributes: type, price, and freshness.1
You can view the live demo survey here, and all files used to create the survey are on this GitHub repo.
Overview
If you’ve never used formr.org before, the video on this page offers a 5 minute conceptual overview followed by ~40 minute demo covering the basics.
Every formr survey is implemented in a spreadsheet. I highly recommend using Google Sheets for this because
- formr has a button on the admin page to quickly re-load your Google Sheet (otherwise you have to upload a new .xlsx file any time you make changes), and
- It’s easier for collaborating and managing different versions.
Each “survey” (each Google Sheet) must be loaded into a “Run” to make the survey live. Most runs include multiple surveys chained together to control complex logic, like filtering out a respondent based on their response to a question.
For this demo, I have designed the run as a combination of three surveys (links below go to each respective Google Sheet):
- Part 1: Intro and target population screen out
- Part 2: Conjoint choice questions
- Part 3: Demographic and other questions
Don’t worry about what’s in each sheet just yet - we’ll get to that.
Creating the surveys
I find it much easier to design my surveys using .Rmd files (one .Rmd file per survey). I can knit each .Rmd file to a html page to preview the look and feel of my survey without having to use formr at all. This also provides a way to easily print out the whole survey content as a PDF (e.g. open the survey in your browser, then print the page to a PDF). When I’m happy with how things look, I then carefully copy-paste the content over into separate rows in a Google Sheet.
For this demo, I designed the questions in each part using the following three .Rmd files in the “survey” folder of the GitHub repo:
| .Rmd file | Google Sheet |
|---|---|
| p1-intro.Rmd | appleConjoint_p1 |
| p2-choice-questions.Rmd | appleConjoint_p2 |
| p3-demos.Rmd | appleConjoint_p3 |
The links in this table let you compare the .Rmd file with the corresponding Google Sheet. Most general content that I want to display to the respondent goes in the label column of the Google Sheet, and response options to questions go in the choice columns (for part 3, I put the choice options on a separate choices tab). Pay careful attention to the type column - this determines the nature of the row (e.g. note just shows the label column content, mc is a multiple choice question, etc.). The calculate type rows allow me to run code to generate and store objects that can be used across different pages in the survey (these values will also be available in the resulting survey data).
Defining the choice questions
The central component of every conjoint survey is the set of randomized choice questions. To implement these in formr, you first need to define the set of choice questions you want to ask each respondent. I use the cbcTools package (which I developed 😄) to create these questions. The code to create the choice questions for this demo survey is in the make_choice_questions.R file in the repo.
The data frame of randomized choice questions is saved as the choice_questions.csv file. Once created, you’ll need to host it somewhere on the web so that you can read it into your Google Sheet. For this demo, the file is hosted on the GitHub repo, but you can also upload your choice_questions.csv file inside your Run (see the “Upload Files” button on the left side menu), which will generate a unique url to the file.
Implementing the choice questions
I implement the choice questions in part two of my survey (the appleConjoint_p2 Google Sheet). To do this, I use the first few rows of the sheet to read in the choice_questions.csv file and make the following calculations:
- Randomly generate a
respondentIDby sampling from all possiblerespIDvalues in the choice questions. - Create a new
dfdata frame that includes only the rows for the specificrespondentID. - Create a
df_jsonobject that converts thedfdata frame to JSON.
That last step is a bit of a hack, but the reason this is necessary is because each new page on formr is essentially a new session, so every time you start a new page all your previous objects are no longer there and all your libraries need to be re-loaded. The only objects you have access to on separate pages are items that are stored in the resulting survey data (using the names assigned in the name column), so we have to serialize the df object into one long JSON object so that we can access it later in other pages.
Once we have everything set up, we can then start defining choice questions. In each choice question row, the first thing I do is define the questions label and then write a code chunk to create multiple data frames to store the values to display for each alternative. For example, on row 10 of the appleConjoint_p2 Google Sheet, you can see the following code chunk under the question label:
In this chunk, the alts data frame is created by converting the df_json object into a data frame and filtering for all alternatives for the first question. Then the alts data frame is broken into three more data frames (alt1, alt2, and alt3) which contain the information about each alternative. These data frames are then used to display information about each alternative. For example, the first alternative is defined using this code:
**Option 1**

<img src=`r alt1$image` width=100>

**Type**: `r alt1$type`
**Price**: $ `r alt1$price` / lb
**Freshness**: `r alt1$freshness`
I copy this code over to each alternative, adjusting the numbers for alternative 2 and 3. When rendered in formr, the three options looks like this:
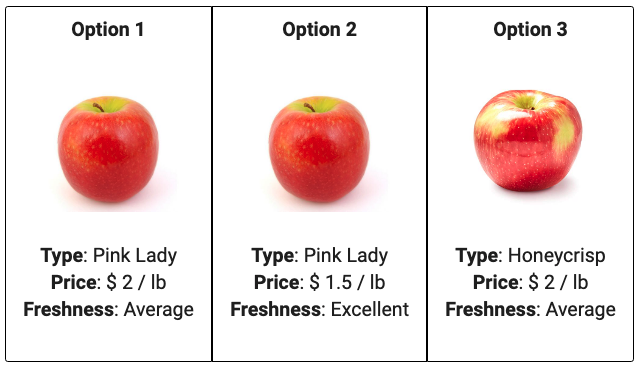
And that’s it! The nice thing about this approach is that the only thing I need to modify in these code chunks for the remaining choice questions is the question number used to define the alts data frame. Other than that, the code for the question label and the alternatives can be reused on the rest of the choice questions.
Buttons versus tables
In the example above, the conjoint choice questions are displayed as “buttons” where all the information for each alternative is shown as a button. This works particularly well for mobile phone applications where the user may need to scroll vertically to see each option.
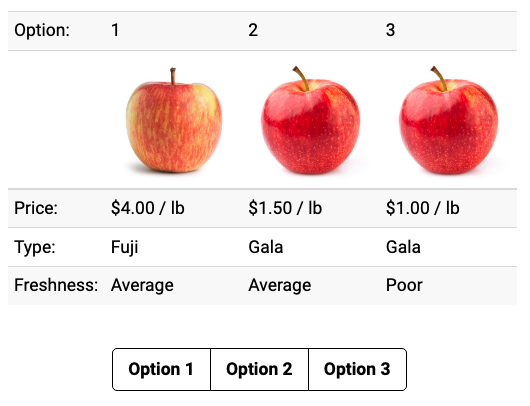
An alternative is to use a tabular layout where each column represents an alternative and the row names explain the attribute. This takes a little manipulation to get it right, but the key concept is to use kable() to display the transpose of the alts data frame. I also use the wonderful kableExtra package to modify some of the table stying. If you want to see this version in practice, the survey link is here, and the Google Sheet with the configurtions for this is here.
library(dplyr)
library(kableExtra)
alts <- jsonlite::unserializeJSON(df_json) %>%
  filter(qID == 1) %>%
  mutate(
    price = paste(scales::dollar(price), "/ lb"),
    image = paste0('<img src="', image, '" width=100>')) %>%
  # Make nicer attribute labels
  select(
    `Option:` = altID,
    ` ` = image,
    `Price:` = price,
    `Type:` = type,
    `Freshness:` = freshness)
row.names(alts) <- NULL # Drop row names

kable(t(alts), escape = FALSE) %>%
  kable_styling(
    bootstrap_options = c("striped", "hover", "condensed"),
    full_width = FALSE,
    position = "center"
  )
Implementing the surveys in formr
You’ll need to upload each Google Sheet survey into formr to convert them into surveys. Go to your admin page, click on “Create Survey”, then import one of the Google Sheets. This creates one survey. On the left panel you can click “Test Survey” to preview it.
Once you have all three surveys loaded into formr, you can then assemble them into a “Run” by clicking on “Runs -> Create New Run”. Give the run a name, then add your survey to the run by clicking on the icon. You’ll want to add all three surveys, and then at the end add a stopping point by clicking the icon. You can use other logic to control how the user navigates through the survey, such as a “Skip Forward” ( icon) to screen respondents out before letting them get to a later part of the survey.
The specific logic used in this demo is as follows:
Start (part 1)
|
V
Check screen out question --> Screen out non-target respondents
|
V
Choice questions (part 2)
|
V
Check choice responses --> Screen out respondents that chose
| all same responses
V
Final demographic and other questions (part 3)
|
V
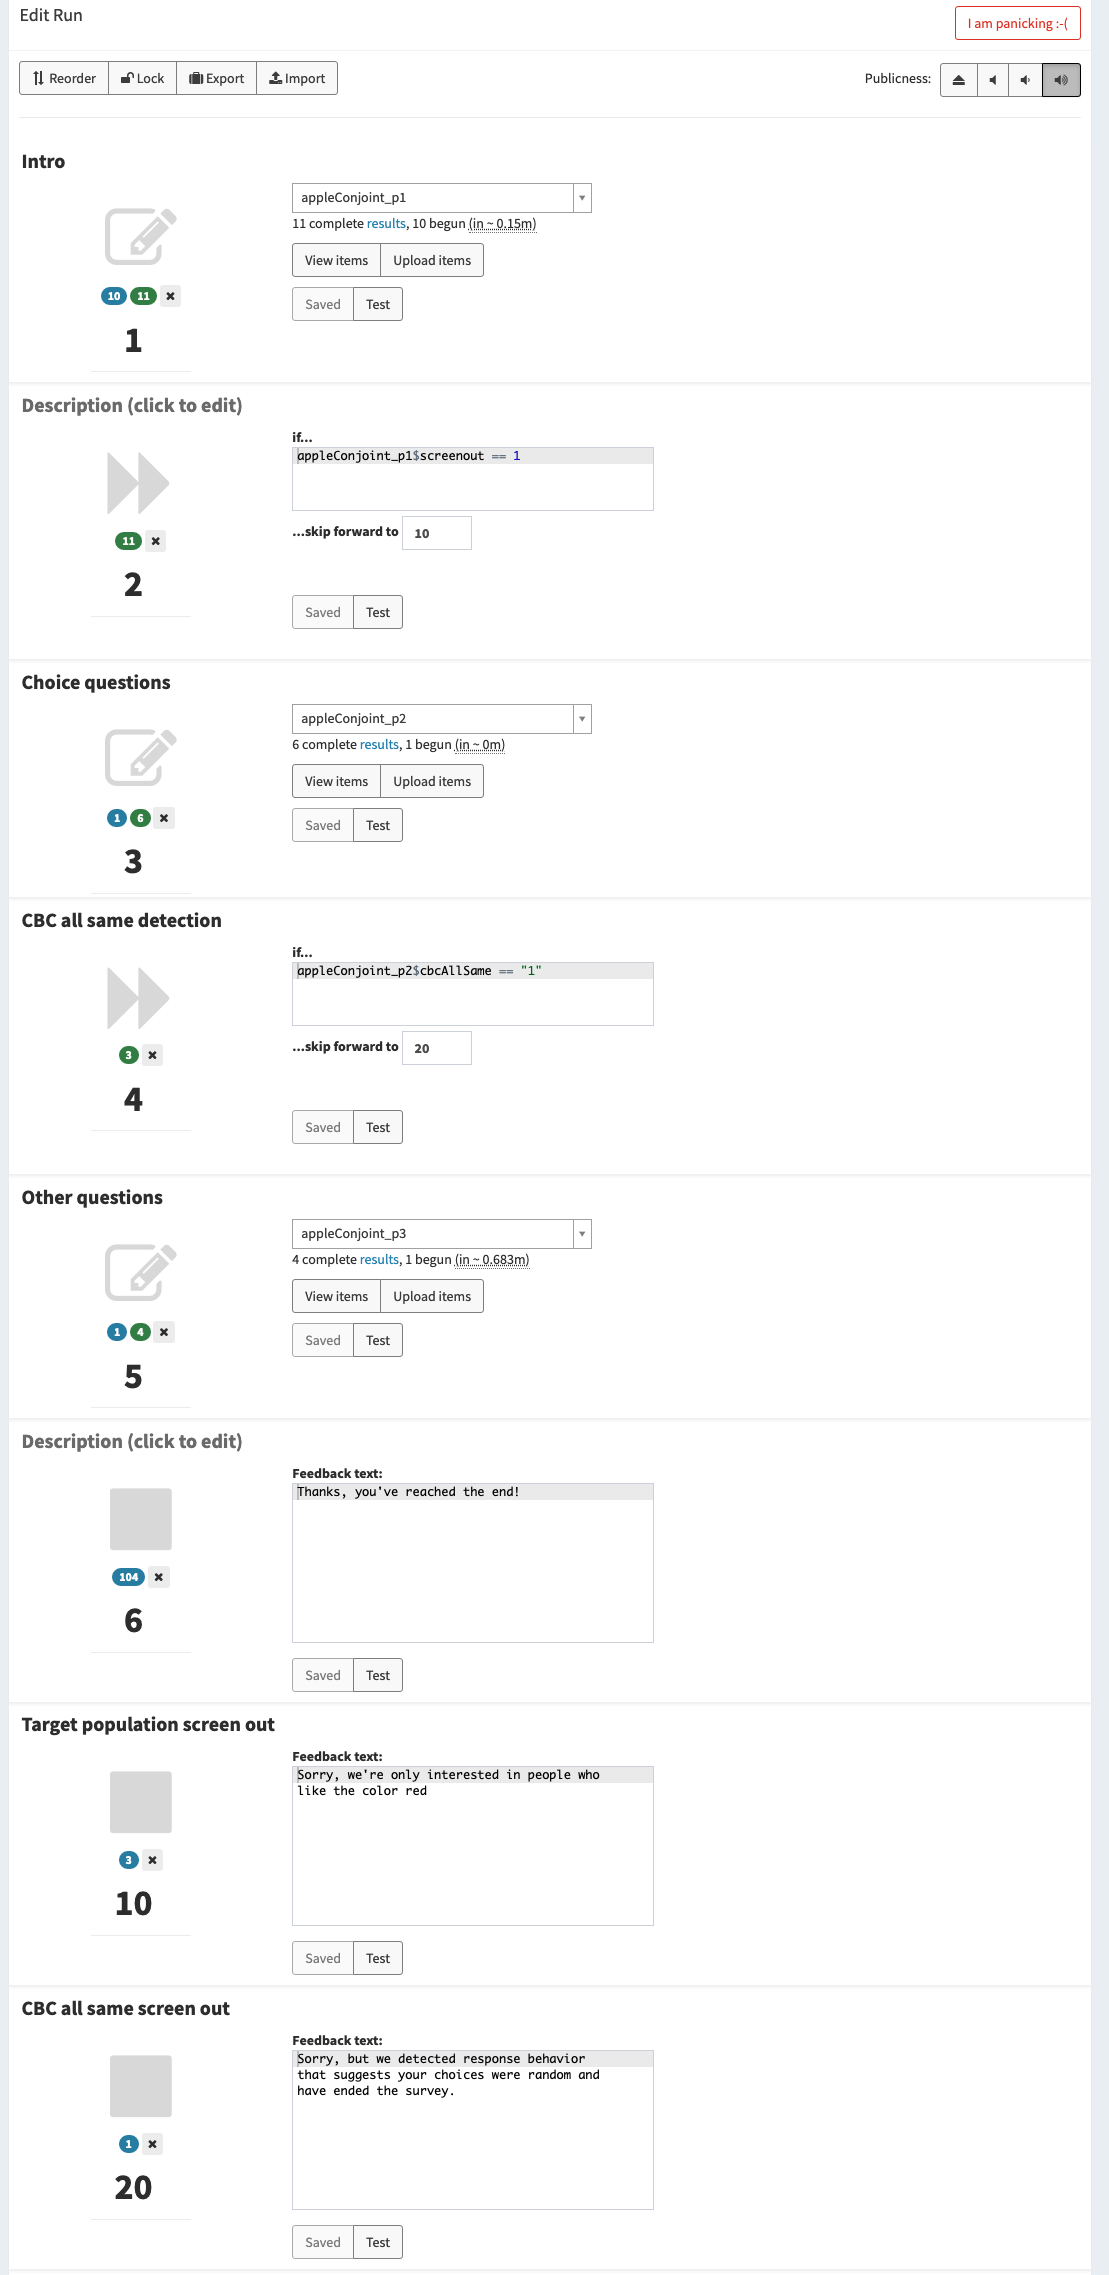
FinishNotice that there are two points where respondents can be screened out of the survey:
- At the end of part 1, I ask a question to identify if the respondent is part of the target population I am interested in. This allows me to screen people out of the survey eary on before they get too far in if they’re not who I’m looking for. In this demo, I ask if they prefer the color Red or Blue and screen out people who chose Blue.
- At the end of part 2, I compute whether or not the respondent chose the same response for every choice question or not, which is a good indicator that they were probably just clicking through the survey. I don’t want these respondents in my sample, so I screen them out here.
Here is a screenshot of the specific run settings:
Time stamps
Since your entire survey is designed in , why not take advantage of that fact to collect more about your respondents? One thing I always do on my formr surveys is grab the time each respondent spends on every page. This is implemented by running Sys.time() at the top of every new page, which I then use to compute the difference between each time stamp to get the time spent on every page. This is useful in general just to be more informed about how your respondents are going through your survey, and particularly useful for examining behavior on the conjoint choice questions.
Preview and check
The link to the survey will be https://your_run_name.formr.org. You can control whether your survey is “live” or not by modifying the “volume” icons. For collecting data, I recommend setting it to the icon, which means people who have the link can access the survey.
But before you go live, it’s a good idea to do some quick testing. You can test each survey separately from their respective survey admin pages, and you can also test the entire run from the run admin page (check the left side menu). When testing, you may get an error - don’t panic! The error pages look a little different from the errors you’re used to in R, but if you click through the errors you can usually find the root cause of the error (the R error message will be buried somewhere on the page). Many times the errors are small typos, which is another reason why I like to initially build my surveys in .Rmd files - when I knit them to html pages, any typos or other small errors are much more easily identified.
Getting the data
Once your survey is live and you start collecting responses, your response data will not be available in the “Run”. Instead, they will be available in each of the three survey pages. You can use the {formr} package to import the data directly in , or just go to the admin page for each survey and download the data as .csv files. The key piece to remember is that each respondent will be given a unique session variable that you can use to join all of the three separate data files together.
With that in mind, keep an eye out for a follow on post on how to join and clean the resulting data from this conjoint demo coming soon!
Footnotes
Yes, people have actually done conjoint surveys on fruit before.↩︎